Know Your Data
Brillersys’ “Know Your Data,” is a powerful advanced tool designed to facilitate comprehensive data analysis. It offers users with a structured and user-friendly interface to explore, summarize, and visualize their data efficiently. By leveraging the capabilities of Snowflake’s data platform, it ensures a seamless experience for users to gain insights into their datasets.
“Know Your Data” enables users to maximize the value of their information resources effortlessly by unlocking complex data structures and uncovering hidden trends.
Key Features
Brillersys’ “Know Your Data” helps to discover the essence through its following core functionalities,
Data Interaction

Create insightful visualizations like bar charts, histograms, box plots, pair plots, and time series charts to uncover data patterns and trends.
Data Summary

Create insightful visualizations like bar charts, histograms, box plots, pair plots, and time series charts to uncover data patterns and trends.
Exploratory Data Analysis
Create insightful visualizations like bar charts, histograms, box plots, pair plots, and time series charts to uncover data patterns and trends.
Interface Overview
1. Data Tab
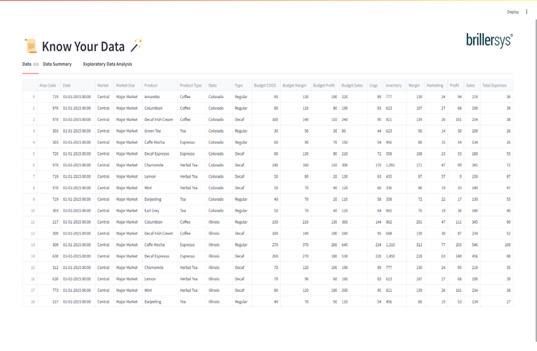
In the Data Tab, users access the primary interface showcasing raw data imported from the snowflake database. With this tab, users can:
Browse the Dataset: View the entire dataset in a tabular format.
Sort Data: Sort data based on various columns to organize and analyze it more efficiently.
2. Data Summary Tab
The Data Summary Tab provides a comprehensive overview of the dataset, enabling users to view the following:
Metrics – Metrics give a quick snapshot of the key metrics, including column and row counts, data completeness, and breakdowns of categorical, numerical and datetime columns.
Statistics– Within the statistics tab under Data summary, users can access essential statistical measures for numerical and categorical columns independently. These measures encompass mean, median, mode, standard deviation, variance, and range.
Data Quality– Under the Data Quality tab, the users will be able to assess the uniformity of data types across table columns and detect missing values, duplicate records, and inconsistent entries. It also helps to investigate data distribution and density by examining non-null values across various columns.


3. Exploratory Data Analysis
Exploratory Data Analysis (EDA) is a crucial step for any kind of data analysis. It is where you seek to understand the structure, patterns, and relationships in your dataset. This Tab is designed for visual exploration of the data, enabling users to create various types of charts and plots. The type of visualization depends on the kind of data.
In our application, EDA is categorized into three distinct analysis area:
1. Univariate Analysis
2. Multivariate Analysis
3. Time Based Analysis
Summary
The “Know Your Data” Snowflake application is a comprehensive tool designed to streamline the data analysis process.
- It provides users with an intuitive interface to explore their data, assess its quality, and generate meaningful visualizations.
- By using this application, users can gain valuable insights into their data, enabling them to make informed decisions based on their analysis.
- The application’s structured approach, divided into Data, Data Summary, and EDA preview tabs, ensures that users can efficiently navigate through different stages of data analysis
- The application presents information from Initial exploration to detailed statistical evaluation and advanced visualization.
Get In Touch

1599 S Dodd Sr, Mountain House, California

+1 (408)-461-5412

info@brillerys.com
copyright @ Brillersys 2024